fundamental limitations
of loudspeaker directivity
By Dr. F. Joseph Pompei

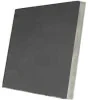
Figure 1: Comparison between the maximum possible directivity of a 16" loudspeaker and the real measurements from a standard 16" Audio Spotlight speaker. Contours are shown for -20dB (90%) isolation.
The advent of the Holosonic® technique for creating tight, narrow beams of audible sound using ultrasound has opened many new applications for sound control. Due to the success of SoundBeam® technology from Holosonics, various manufacturers have begun promoting traditional loudspeaker products as "highly directional" or "tightly focused". These typically take the form of large loudspeaker panels, arrays, or domes, sometimes adding phasing or other manipulations.
The directivity of all traditional loudspeaker devices is fundamentally limited by nothing more than the size of the source compared to the wavelengths it is generating. A large loudspeaker will be more directive than a small loudspeaker, or a loudspeaker specified at higher frequency (smaller wavelength) will also have more directivity. No amount of phasing, shading, focusing, or other method can overcome this fundamental limit; in fact, any of these methods will always reduce directivity.
The Audio Spotlight sound beaming device product line bypasses this fundamental limitation by using nonlinear acoustic techniques to create sound literally in mid-air using the nonlinear action of ultrasound. This sound beaming technology permits far greater directivity than any other loudspeaker in the world, with remarkable directivity and isolation abilities.

While the analysis in this paper should be well known to most people with a background in acoustics or general wave mechanics, it is designed to alleviate much of the confusion arising from exaggerated claims made by some manufacturers. A basic mathematical proof is provided, as well as simulations of a best-case ideal loudspeaker device.
BASIS OF LOUDSPEAKER DIRECTIVITY
The maximum directivity ('narrowness') of any traditional loudspeaker ultimately depends only on its physical size relative to the wavelengths it's producing. No amount of phasing, focusing, or other manipulation can alter this inherent physical limitation.
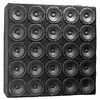
To make any loudspeaker more directional, one can only make the loudspeaker physically larger, either by creating a large active surface, or, as an equivalent, by using a large number of small speakers, driven in aggregate to form a large radiating surface.
MATHEMATICAL PROOF
It is well known that the angular response of any wave source is equal to the scaled Fourier transform of the source driving function [2]. That is: $$ H(\phi)=\int s(\hat{x})e^{j2\pi\hat{x}\phi}=\mathcal{F}[s(\hat{x})] $$
where \(\hat{x}=x/\lambda\) and \(\phi = \sin(\theta)\)
The angular response of this window response is the well known sinc function:
\(W(\phi)=\text{sinc}(\pi\phi L / \lambda)\)
Figure 3: The angular response for all uniform loudspeaker sources, which also shows their theoretical maximum directivity, is shown. The x-axis is scaled according to speaker size and wavelength.
For a 36" (91 cm) speaker at 2kHz, \( L/\lambda \) is 5.3, so the range -90 degrees to 90 degrees corresponds to the x axis range of -5.3 to 5.3, as shown. In this case, the main lobe has narrowed considerably, and the presence of numerous sidelobes has appeared. This graph can be used to predict the maximum theoretical directivity of any loudspeaker, for any desired size and frequency.
In the Fourier domain, the multiplication operation is replaced by convolution, so the expression describing directivity of the source is:
$$H(\phi)=R(\phi)*W(\phi)$$
The resulting directivity of the source is therefore the result of convolving the (arbitrary) source function with the (fixed) window function.
The very same Fourier equation is found in signal processing, particularly in windowing and filter design. A wide variety of windows \(r(\cdot)\) have been developed, each allowing tradeoffs between main lobe width and sidelobe levels. For specifically minimizing the width of the main lobe, no window function can improve on the rectangular window [3].
Therefore, for maximizing directivity, a simple, unphased, uniform source is the optimal configuration. Shading and/or phasing the source function can reduce sidelobe levels, but it is always at the expense of reducing main lobe directivity.
1D EXAMPLE: SOUND BARS
From the analysis above, the maximum possible directivity of a sound bar of length \(L\) is
$$H(\phi)=\text{sinc}(\pi\phi L/\lambda)$$
Mapping this to real angle \(\theta\),
\(H(\theta)=\left|{\frac{\sin[(\pi L/\lambda)\sin\theta]}{(\pi L/\lambda)sin\theta}}\right|\) [4]
The key parameter determining directivity is, once again, the ratio of the size of the speaker relative to its wavelength. Note that these arrays have only one long axis – because the vertical axis tends to be very small, sound is almost perfectly omnidirectional, and directivity is essentially nonexistent.
Example: 24” sound bar, 3” high, 1kHz frequency
Horizontal field width:
29 degrees (-3dB, or 30% reduction in level)
>180 degrees (-20dB, 90% reduction in level)
Note that sound levels are never reduced by 90% or more, regardless of angle. Also note the large "side lobes" present in the response.
Vertical field width:
Almost perfectly omnidirectional. No directivity at all is expected; sound will propagate evenly along the vertical axis.


Figures 4a and 4b: Maximum possible directivity from a 24" sound bar, at 1kHz. Note limited directivity for the horizontal axis (left), and the complete absence of directivity on the vertical axis (right).
2D EXAMPLE: SPEAKER PANELS
Speaker panels, whether they are made from a single radiating element or an array of small loudspeakers, are simply the 2D form of the Speaker Bar mentioned above, and will all have the same maximum directivity. In this case, the horizontal and vertical dimensions are equal. Therefore, the sound field pattern is identical to that of the Sound Bar’s largest dimension, but for both horizontal and vertical angles.

Figures 5a and 5b: Maximum possible directivity for a 24" speaker panel, at 1kHz, which is identical for both horizontal and vertical axes.
The graphs above show the directivity in the so-called far field, where the listener is distant from the source, as is the convention in acoustic specifications. The near field is also straightforward to analyze via simulation, as closed-form mathematical solutions do not exist.
The simulations below were performed for a perfect, uniform acoustic source, which creates maximum possible directivity. The plot scales are meters and dB, and for visualization, both the source size (black rectangle) and the wavelength (grey rectangle) are shown to the left of the graph. The -3dB and -12dB beam angles (when they exist) are shown with dotted and dashed lines, respectively.
FIXED SOURCE SIZE, VARYING WAVELENGTH
The first set of simulations is of a fixed source size (0.4m/16"), with varying wavelength. From the results above, we expect to see an omnidirectional response for a large wavelength relative to source, and higher directivity as wavelength decreases.
Figure 6: Ideal sound fields from a 16"/0.4m source, with varying wavelength. Directivity is weak for wavelengths similar to source size, but increases for very small wavelengths (high frequencies).
This is precisely what is observed; for wavelengths much larger than the source, the sound field is omnidirectional. Modest directivity is shown for wavelengths similar to the source size, and as the wavelength decreases to a small fraction of the source size, the loudspeaker is always naturally directional.
FIXED WAVELENGTH, VARYING SOURCE SIZE
For an alternate perspective, simulations were done at a fixed wavelength, while varying source size. As it is where the ear is most sensitive and most real-life content is centered, 1kHz is used for analysis, and has a wavelength of 0.35m. One would expect loudspeakers much smaller than this to have an omnidirectional response, while loudspeakers much larger than 0.35m (14”) would be more directional.

Figure 7: The wavelength is fixed at 0.4m (1kHz) while the source size is varied. A source smaller than or comparable to the wavelength is mostly omnidirectional, while a large source becomes more directive.
For a small source ¼ of the wavelength, the sound field is again omnidirectional. As the source size increases, directivity increases as expected, though the coverage area also grows substantially. But notable directivity exists only when the size source is much larger than the wavelength.
PHASING AND FOCUSING
Phased arrays have been used for decades to steer and/or focus acoustic energy, as well as other wave sources (such as radar). The basic principle is to apply a suitable delay (or phase offset) to each small portion of the source, such that the sum of contributions from each portion of the array sum constructively along the desired direction (for a steered array), or at a particular point (for a focused array). As isolation is typically the goal of directivity, the focused case will be simulated. Phasing a linear array is acoustically equivalent to building a perfectly curved loudspeaker array, or using a perfect reflecting surface.
For this simulation, we will allow a very large loudspeaker size of 1m (39"), and a 1kHz tone. Distance is analyzed continuously from 0.5m to 2.5m. A small circle marks the focal point.
Figure 8: Sound fields from a 1m source playing 1kHz, perfectly focused to distances ranging from 0.5m to 2.5m. Focus is apparent at short distances, but has no clear effect at distances longer than about 0.5m.
A reasonable degree of focus is noted for the 0.5m case, but the sound fields for focal lengths beyond this are nearly identical to the unfocused case. This makes sense qualitatively; one cannot expect to focus effectively at distances much further than the size of the source array.
Note also that while focusing is effective for very short distances, the cost is directivity – outside the focal point, sound expands far more than it would have with an unfocused array. Therefore, as a practical matter, focusing arrays are not effective for providing localized listening zones.
CONCLUSIONS
Loudspeaker sources of a variety of configurations are used to illustrate that even under ideal circumstances, directivity and localization of sound is extremely limited. No degree of phasing, focusing, or other manipulation can improve these results, as they are an inherent limitation of linear acoustics.
The Holosonic® technique for sound generation in the Audio Spotlight is a fundamentally different way of creating sound, and is not limited by the barriers facing traditional acoustics illustrated above. This is because the source of sound from an Audio Spotlight is not the physical loudspeaker panel – it is the volume of air in front of it. This makes the actual sound source far larger than the physical loudspeaker seen – it just happens to be invisible, and made from ultrasound. This enables the Audio Spotlight to fundamentally provide far more directivity and isolation than any loudspeaker can ever provide.
2 Pompei, F. J., "Phased array element shapes for suppressing grating lobes", J. Acoustical Society of America, v111n5, 2002.
3 Harris, F. J., "On the Use of Windows for Harmonic Analysis with the Discrete Fourier Transform", Proc. IEEE v66n1, 1978.
4 Beranek, Acoustics, p. 96
We would love to speak to you about your audio needs. Please complete the form below to request more information on Audio Spotlight. Someone will respond within one business day.